Sap Solution Manager Technical Monitoring Dashboard
SAP Solman - Infrastructure
SAP Solution manager consists of various infrastructure components- application management solution, and complete IT landscape. The solution discovers- technical monitoring and alerting infrastructure, system landscape information, integration of Solution Manager with SAP IT Infrastructure.
Integration between SAP Solman and IT infrastructure brings more advantages like −
- You can directly access data from SAP Solution Manager regarding IT Service Management processes.
- You can link Incident, Problem, and Change management to infrastructure information.
- It provides enhanced monitoring information inside SAP Solution Manager.
Technical Monitoring and Alerting Infrastructure
The infrastructure allows you to improve the health of your system in complex system landscape. It provides many advantages over common central CCMS monitoring.
You have to configure only central system- SAP Solution Manager and this configuration is distributed automatically to the managed systems.
The following functions can be performed using Technical monitoring and alerting infrastructure −
- You can perform a detailed view of all infrastructure components.
- The diagnostic agents are automatically updated and configured.
- It provides end-to-end monitoring and alerting for all the components in Landscape.
- You can monitor and manage infrastructure alerts in SAP Solution Manager Alert Inbox.
Select Technical Monitoring under Business process Operations.
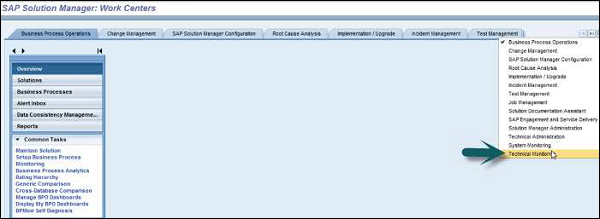
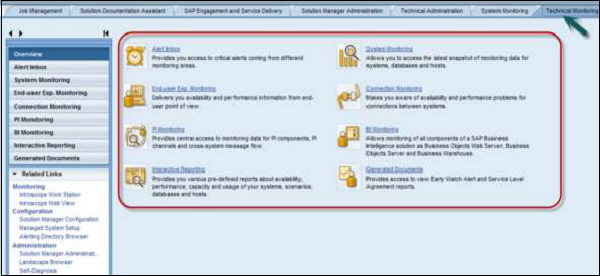
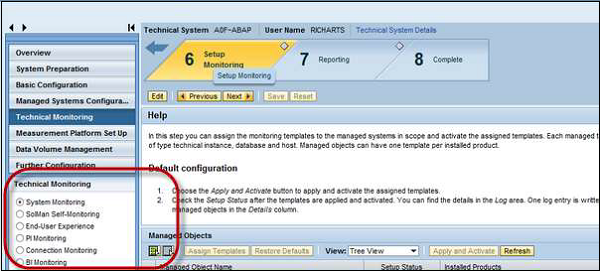
Under Technical monitoring, you can perform various types of monitoring options −
-
System Monitoring − To perform the monitoring of all the systems in SAP Solman System Landscape.
-
Connection Monitoring − This is used to monitor connections in your IT Infrastructure.
-
BI Monitoring − This is for Report monitoring.
-
PI Monitoring − To monitor Process Integration between different systems. You can select and monitor each component in this landscape by using date from System Landscape Directory.
-
End-User-Experience monitoring − To monitor the Performance and availability of technical systems from different locations.
Application Incident Management and Change Management
In SAP Solution Manager, Incident management is closely related to Service desk to manage all your issues related to Applications. When an application fails to deliver the required performance during normal service hours, you need to restore the service to normal operation as quickly as possible. This process is known as Application Incident Management.
Change Management process deals with managing changes in Infrastructure. Change Request can be raised for any routing activity like Patch management, or an urgent change to restore an application/service.
Step 1 − To perform incident management and change management, you can search fields such as Function type, Manufacturer and Name of CI using the search criteria.
Step 2 − From the incident name or change #, you can see the details of Configuration Item
Step 3 − Under Master data, there is a link to search CMDB and LMDB.
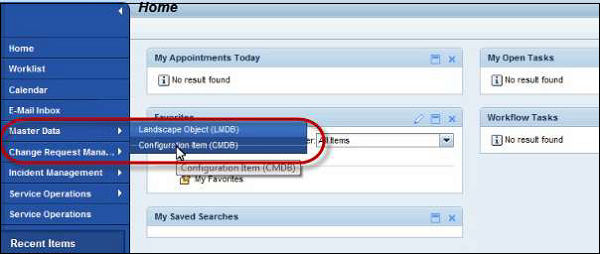
Step 4 − To see all the transactions assigned- Incident # and Change # to a Configuration item, you can perform a search in CMDB.
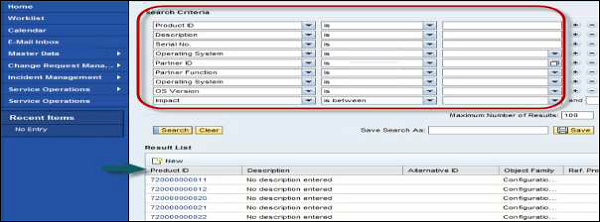
Step 5 − By clicking on any CI, you can view all technical details, object organization data for CI as shown below −
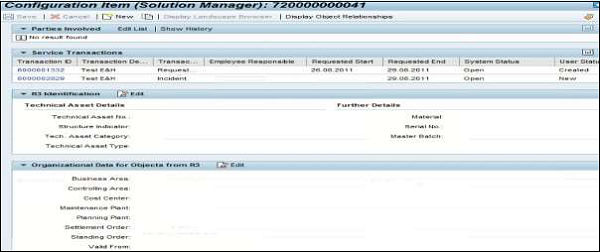
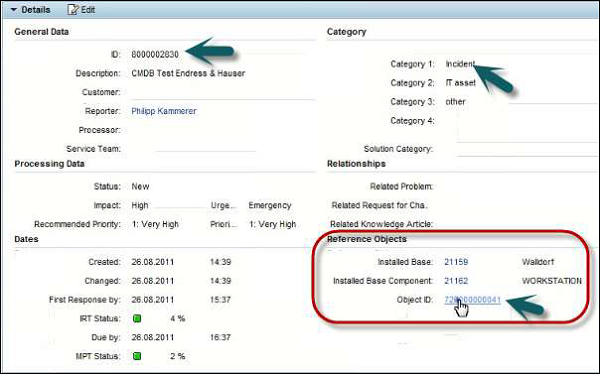
Step 6 − Based on the Configuration item, product ID or object ID, you can create an Incident or Change request in Solution Manager.
CI is available under Object ID in Incident details as shown below −
In SAP Solution Management infrastructure, you can use Landscape Management Database (LMDB), which is a central landscape information repository. It uses the same information as the System Landscape Directory (SLD) to enter the system information.
LMDB connection to SLD
LMDB gets all the information from the System Landscape Directory where all the system registers itself. Most of the technical systems contain data suppliers that provides direct information to SLD for registration.
The LMDB receives SLD changes automatically when a change occurs, using polling by LMDB, or active change notifications by the SLD.
Work Modes
You can use various work modes in SAP Solution Manager to perform the following activities −
- Maintenance
- System Migration
- Patch upgrades
- Customizing changes
Work modes can be divided into further two categories −
Technical work mode
Following types of Technical work modes can be used −
-
Planning Downtime − Technical work mode is defined as the work mode during which the system is technically down and you do not have access. System administrators can use this work mode to perform planned administration tasks that can only be performed during downtime.
-
Maintenance Mode − Work mode during which the system is technically up and you have no access. System administrators can use this work mode to perform planned administration tasks that can only be performed during maintenance.
Business Work modes
The following types of business work modes can be used −
- Peak Business Hours
- Non-Peak Business Hours
- Non-Business Hours
Note − To use the Work Mode Management reporting functionalities, Monitoring and Reporting has to be enabled for the managed systems.
Roles
The following roles are required to perform Work mode management and IT calendar activities −
- SAP_SM_DTM_DIS Work Mode Management (Display authorization)
- SAP_ITCALENDER Display of Work Modes in IT Calendar
- SAP_NOTIF_DISP Notification Management
- SAP_SMWORK_SYS_ADMIN Work Center: Technical Administration
- SAP_ITCALENDER Display of Work Modes in IT Calendar
Planning a Work Mode
To Plan a Work mode, you have to navigate to Technical Administration Work Center.
Step 1 − Select Work Mode Management → Type Selection area, select a component type.
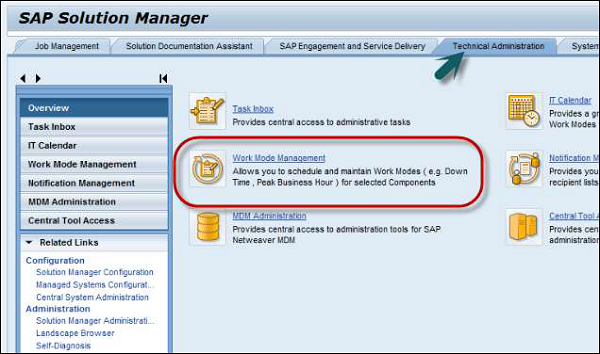
Step 2 − When you select a component type other than EEM Robots, perform the following −
- Go to Detailed Selection area, select a query.
- Group the technical components in queries for faster access.
- In the query, select the technical component → Select Work Mode Management
- Display the work modes, embedded or in a new window.
(An EEM robot is used to perform End user monitoring and is a run time agent. This is used to replay the scripts and one robot per monitoring location is required to perform EEM monitoring),

Step 3 − A hierarchical view of the technical components and details of the current and next work modes are displayed. Next is to select the component. You can see a list of work modes for the component.
Step 4 − If you have selected the component type EEM Robots, select a robot. The list of work modes for the robot is displayed.
Step 5 − Enter Schedule Work Modes. In the Schedule Work Mode for technical component screen area, you can enter the required data.
Note − You can plan only peak business hours, non-peak business hours, or non-business hours for an EEM robot.
Configuring Technical Monitoring as per Work Modes
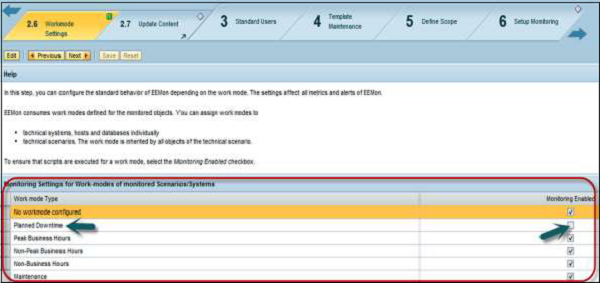
In SAP Solution Manager, you can setup work modes for Technical Systems, databases and technical scenarios. You can switch off complete technical monitoring or modify single metric thresholds of specific systems.
For each work mode, you can define if monitoring is enabled or not. If you observe that the Planned Downtime check box is deselected, it means alerting and monitoring is disabled
Sap Solution Manager Technical Monitoring Dashboard
Source: https://www.tutorialspoint.com/sap_solman/sap_solman_infrastructure.htm